Stefan Wagner
«Truth can only be found in one place: the code.»
Blog | Archive | Resume | Projects | References
Wiki History Book
09 Jul 2014 | graph, d3js, javascript
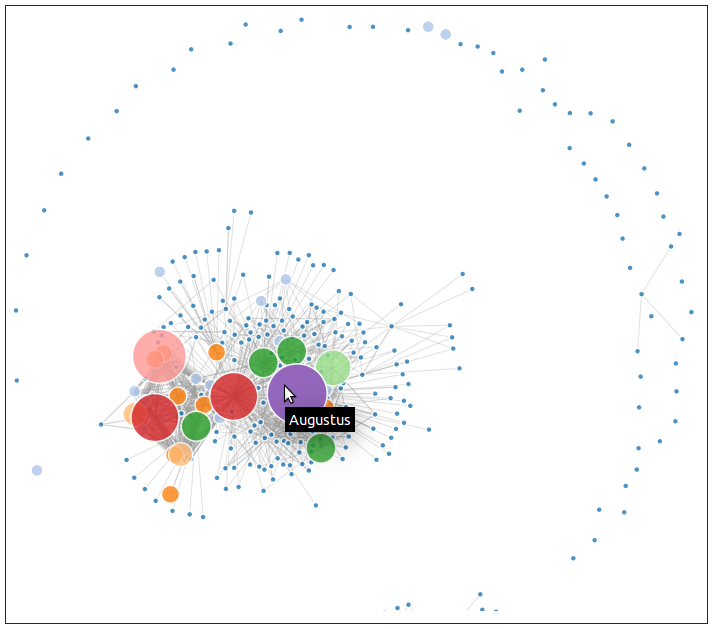
As per a request of Professor Dr. Peter Gloor of the Massachusetts Institute of Technology, MIT, Center for Collective Intelligence I’ve worked out three different versions of a graph representation on the connections among famous people of English Wikipedia. Each person was represented by a node. More people referred to a person, thicker got its node.
The main requirement was that the representation was in the browser. The three different versions were:
- an java applet, dynamic applicatoin on the client side
- an static SVG, rendered on the server side
- an mix between the first two versions, calculations on the server and rendering on the client with d3js
The most interesting was the third version with d3js. However the issue was the number of edges among nodes that rose exponentially and got closer to the present. There were too many edges for the javascript to handle in the browser. The solution was that we suppressed a certain number of edges in order to be able to run the script.
You see the wiki history book here and the source code is here.